PredictionToolkit
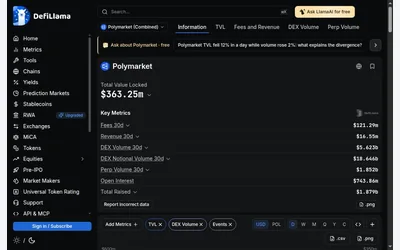

Compare venue activity and investigate Polymarket history with explicit metric and product definitions.
- Access Web
Find your toolkit
Choose an analytical view for traders, markets or builder activity. Establish whether the listing offers a hosted service or reusable application source that you must run yourself.
A screenshot or source repository does not establish a working hosted dashboard. For self-hosted code, the application’s backend and dependencies determine whether the view can be reproduced.
Compare venue activity and investigate Polymarket history with explicit metric and product definitions.
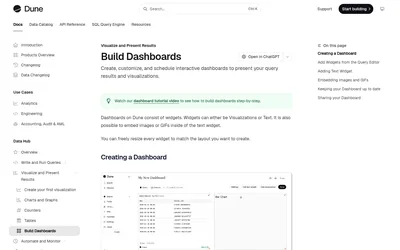
Query blockchain activity with SQL and publish dashboards for volumes, wallets, fills and custom research.
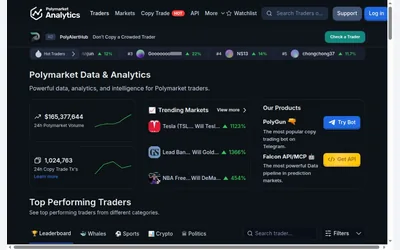
Public trader rankings with category views, detailed numeric filters and wallet/market research.
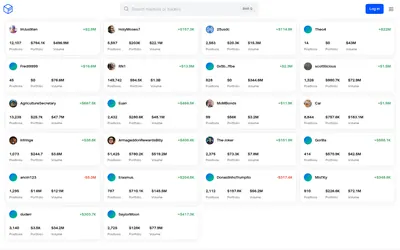
Inspect a trader's positions and P&L, add imported venue history or generate your own yearly wallet report.
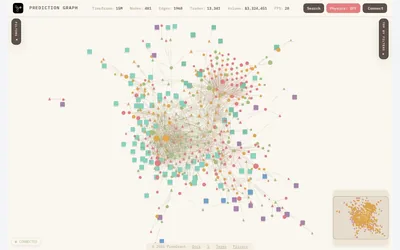
A network view connecting Polymarket traders, market questions and outcome tokens through recorded trading activity.
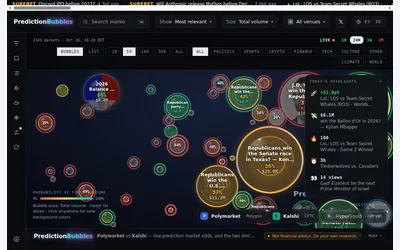
A visual market map whose bubble size follows a selected activity measure and whose color represents first-outcome probability.
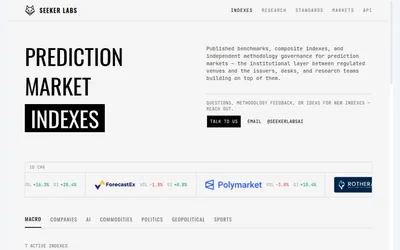
Explore themed prediction-market benchmarks and their construction, keeping consensus, disagreement and venue activity distinct.
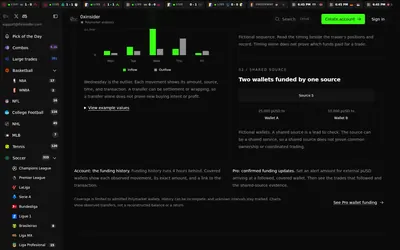
Compare sports prices and graded-wallet exposure, inspect unusual trades and connect the same research to an API.

Follow themes across event contracts using constructed indices, reference rates, research dashboards and market briefings.
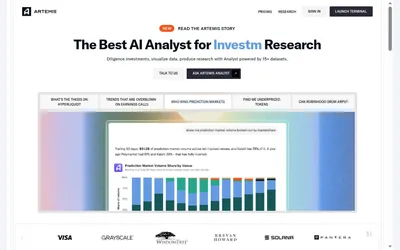
Prediction-market sector research within a broader financial platform, with question-driven analysis and exportable charts and tables.
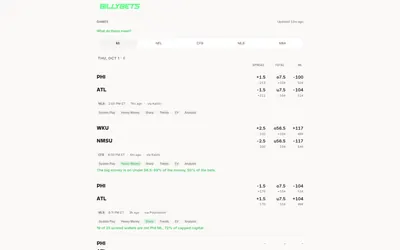
Compare sports prices and signal reasons in the app or query the same precomputed game research through MCP.
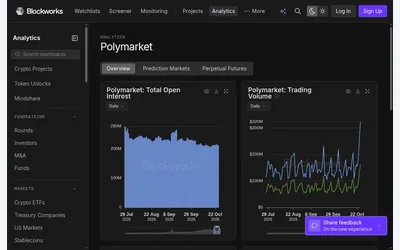
Volume, open interest and participation charts with market, category and lifetime-volume wallet segments.