PredictionToolkit
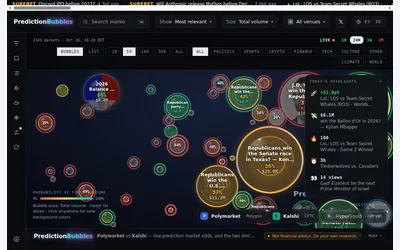

A visual market map whose bubble size follows a selected activity measure and whose color represents first-outcome probability.
- Access Web
Find your toolkit
Bring several prediction-market views into one workspace. Choose an aggregator for discovery or comparison, then verify which venues support the actions you need.
Two events with similar names may have different rules or settlement terms. Read the precise questions before comparing prices as though the contracts were equivalent.
A visual market map whose bubble size follows a selected activity measure and whose color represents first-outcome probability.
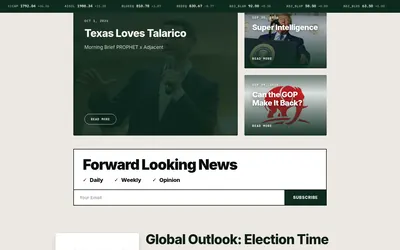
Follow themes across event contracts using constructed indices, reference rates, research dashboards and market briefings.
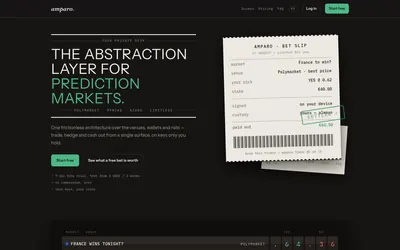
Compare supported venues, inspect local signing and use modular access with separate funding and contract checks.
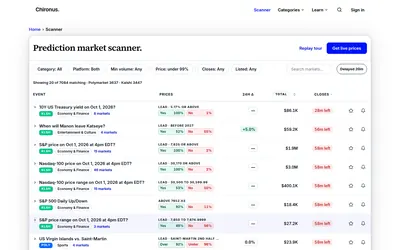
Search both venues, follow contracts, set supported alerts and test ideas with a resettable practice balance.
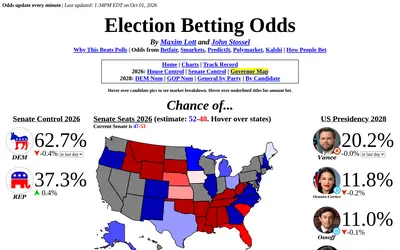
Compare election probabilities across venues, inspect bid/ask ranges and follow race history and state maps.
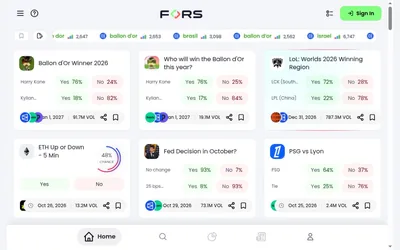
Compare venue-labelled events and investigate analytics and copy controls before assessing execution access and costs.
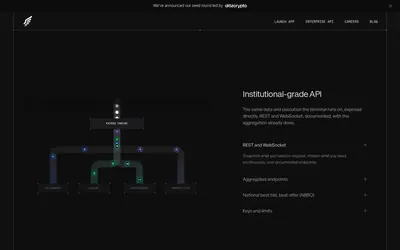
Use an aggregated terminal or scoped enterprise API for data, orders, positions and trader intelligence.
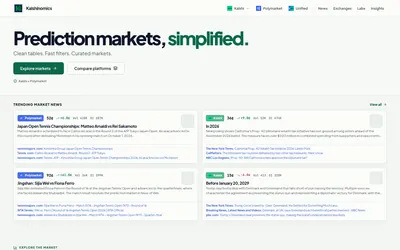
Research both venues through searchable tables, weekly digests and focused underlying-asset dashboards.

Research wallets, receive independent alerts and configure copying through one web and Telegram account.
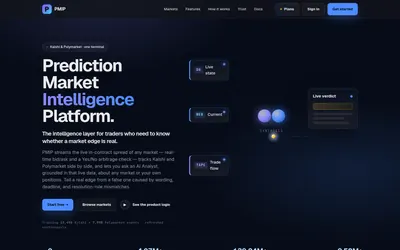
Investigate why a cross-venue price gap exists before treating it as a trading opportunity.
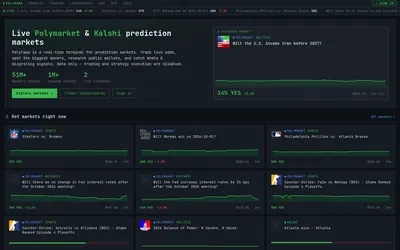
Compare market movers and public traders using the venue, ranking metric and time window relevant to your question.
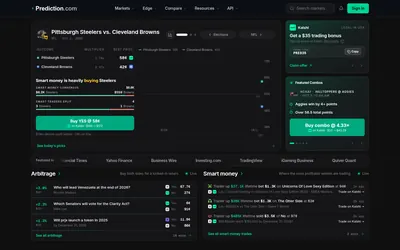
Compare venue quotes, calculate costs and explore strategies with paper tools before choosing a trading route.