 PredictionToolkit

What is Kalshinomics?
Choose a venue or the combined table, search an event and apply filters at the event or individual-market level. Compare probability, volume and open interest as separate measures. Similar titles in a unified table do not establish matching thresholds, periods or settlement rules.
The oil dashboard illustrates the Labs approach by placing CL spot context beside closing-price probabilities and positioning. This can help frame an event question, but movement in the underlying asset does not uniquely determine its probability. News, explainers, daily movers and weekly digests supply other routes into the same research.
Who it is for
- Users researching Kalshi and Polymarket side by side.
- Readers following daily movers and weekly market summaries.
- Researchers comparing underlying-asset context with event contracts.
Features and coverage
- Venue and Unified sections
Open Kalshi, Polymarket or combined coverage and choose between event and market discovery levels.
- Exchange overview
Compare venue coverage and activity measures, checking what each measure represents.
- Weekly intelligence
Read market digests and mover summaries, then return to the relevant table for detail.
- News and explainers
Follow reporting and analytical explainers alongside market discovery.
- Focused Labs views
Explore purpose-built experimental research tools, including the oil dashboard with CL spot context, probabilities and positioning.
- Contract exploration
Navigate from broad event coverage to a selected market and its source contract.
Workflows with Kalshinomics
Compare venue coverage
Search the same event in Unified and open each source contract to reconcile its definition and rules.
Prepare a weekly review
Read the digest, identify large changes and investigate them in the relevant event or market table.
Study an oil threshold
Compare the underlying asset context with the exact prediction-market threshold and read the contract’s resolution terms.
Pricing and total cost
The public site provides discovery and research without displaying a subscription price. This does not establish the charges or account requirements of the source trading venues.
Getting started
Before you start: Contracts in the combined table may have different definitions or activity measures.
- Choose Kalshi, Polymarket or Unified, search the event and apply the relevant filters.
- Inspect volume, open interest and probability separately; open a relevant Labs dashboard when useful.
- Follow the original contract to read its full rules before comparing or acting on it.
Combined tables can contain contracts with different definitions; similar titles alone are insufficient for comparison.
Useful links
What to check
- Contracts in the combined table may have different definitions or activity measures.
- Some homepage aggregate counters load dynamically. Use populated tables instead of placeholder totals.
- An underlying asset’s movement does not uniquely determine an event probability.
A closer look
Ratings & reviews
User reviews 0
The main score switches to user ratings after 5 published reviews.
A specific example helps the next person choose the right tool.
Related tools
Browse category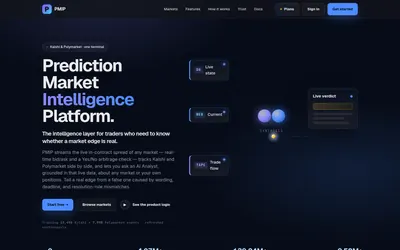

Investigate why a cross-venue price gap exists before treating it as a trading opportunity.
- Trading mode Read-only
- Access Web · Discord · Email
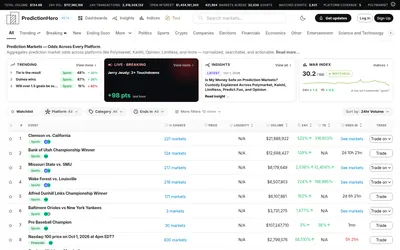

A cross-venue event browser with matched groups, liquidity filters, watchlists and thematic indices.
- Access Web · Email
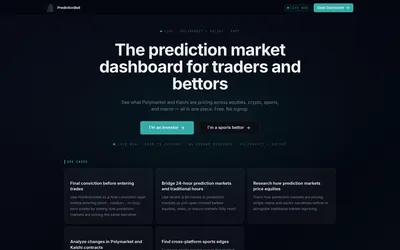
A free research screener for sports, financial and macro contracts on Polymarket and Kalshi.
- Trading mode Read-only
- Access Web
Frequently asked questions about Kalshinomics
Does Kalshinomics include Polymarket?
Yes. There are separate Kalshi and Polymarket sections as well as a Unified view.
What does Labs contain?
It hosts focused experimental research views, such as the oil dashboard that combines underlying-market context with event probabilities.
Is this an order-entry bot?
The reviewed offering is for discovery and research; use the source contract links to investigate venue rules.