PredictionToolkit
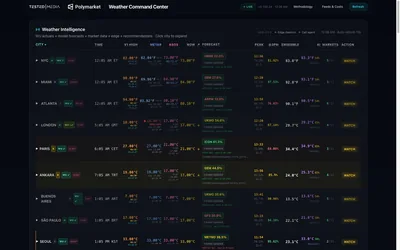
An open-source temperature-research interface with station comparisons, forecast freshness and clearly synthetic demo data.
Find your toolkit
Choose an analytical view for traders, markets or builder activity. Establish whether the listing offers a hosted service or reusable application source that you must run yourself.
A screenshot or source repository does not establish a working hosted dashboard. For self-hosted code, the application’s backend and dependencies determine whether the view can be reproduced.
An open-source temperature-research interface with station comparisons, forecast freshness and clearly synthetic demo data.
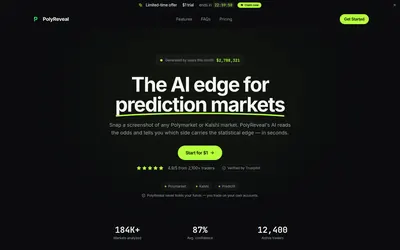
Screenshot-based research and daily picks with model fair values, confidence scores and written reasoning.
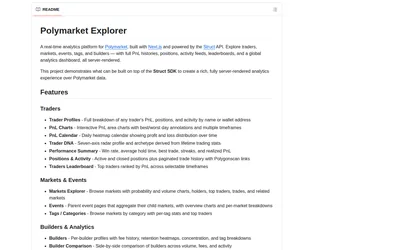
A Next.js analytics application reference with trader charts and market pages, requiring a replacement for its former backend.