 PredictionToolkit

What is Struct Polymarket Explorer repository?
The page model covers traders, markets, events and builders, with a global dashboard and reusable charts, tables and export controls. Trader views combine P&L charts, heatmaps and positions, while market pages connect probability history with holders and trades.
Server-side fetching keeps the provider key out of browser requests and deduplicates rendering reads. That architecture does not restore access to the former service. Choose a working replacement, map its identifiers and accounting definitions, then verify each adapted chart before considering the application operational.
Who it is for
- Developers building an analytics frontend.
- Teams studying trader and market page architecture.
- Existing installations migrating away from Struct.
Features and coverage
- Trader profiles
P&L charts, daily heatmaps, positions, activity and performance summaries.
- Trader DNA
Radar-style displays derived from lifetime trading statistics.
- Market and event pages
Probability charts, holders, trades and related markets.
- Builder analytics
Fee history, retention and side-by-side comparisons.
- Global dashboard
Volume, trade counts, fees and trader activity.
- Search and sharing
Command-palette navigation and PNG chart exports.
- Server data layer
Server-only provider keys and deduplicated rendering requests.
Workflows with Struct Polymarket Explorer repository
Reuse the page architecture
Inspect trader, market and event routes and map their data needs to a current provider.
Replace the Struct dependency
Replace SDK calls, reconcile P&L definitions and verify charts against new response shapes.
Adapt a shareable chart
Reuse chart/image-export components while retaining displayed-data provenance.
Pricing and total cost
The repository lists no hosted subscription. Hosting and replacement data access have separate costs; the original Struct Polymarket service is discontinued.
Getting started
Before you start: The original Struct dependency has been sunset.
- Inspect server-side Struct SDK calls and select a current replacement provider.
- Use the documented Node.js/pnpm environment and map models and identifiers.
- Adapt data calls, verify P&L and activity, and configure authentication/analytics only if needed.
The README’s Struct key requirement no longer establishes a working data service.
Useful links
What to check
- The original Struct dependency has been sunset.
- A missing key shows setup state rather than live analytics.
- Adapt authentication defaults and allowed origins outside the original deployment.
- Public code does not grant access to the former backend.
A closer look
Ratings & reviews
User reviews 0
The main score switches to user ratings after 5 published reviews.
A specific example helps the next person choose the right tool.
Related tools
Browse category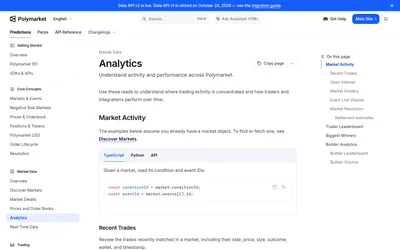

Retrieve positions, trades, holders and rankings while preserving outcome IDs and pagination context.
- Access API
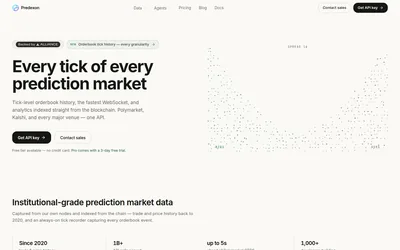

Combine market and wallet data with live channels, then quote historical tick slices when needed.
- Access API
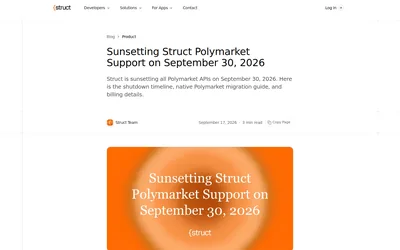
The Polymarket API and hosted Explorer have closed; use the shutdown guidance to replace an existing integration.
Frequently asked questions about Struct Polymarket Explorer repository
Will deployment immediately produce live data?
The Struct data dependency needs a current replacement first.
Is this Struct’s hosted API?
It is the application repository that consumed that API.
Where is the provider key used?
Data fetching runs server-side.
Which parts can inform a new project?
Routes, trader views, charts, tables and image sharing.