 PredictionToolkit

What is DefiLlama Prediction Markets?
Use the sector table to spot differences between prediction-market protocols, then open the protocol profile to understand the figures. Polymarket’s page shows historical measures including volume, fees, revenue and deposited or locked capital. A combined protocol profile can cover several products, so select the individual product when comparing a narrower scope.
Choose a consistent metric and period and read the methodology or linked adapter code before quoting a result. TVL, open interest, fees and trading volume describe different quantities; missing coverage is not proof of no activity. Core dashboards and supported public endpoints are free, while paid research tools and premium API access are separate offers. These protocol-level figures do not establish a wallet’s returns or suitability for copying.
Who it is for
- Researchers comparing activity across prediction venues.
- Developers checking metric definitions before building a report.
Features and coverage
- Sector comparison
Compare prediction-market protocols in the same table and time window.
- Polymarket history
Inspect protocol-level series and distinguish a combined profile from the products it tracks.
- Metric methodology
Read calculation notes and follow adapter code when providers report different figures.
- Different activity measures
Review volume, fees, revenue and locked capital without treating them as interchangeable.
- Data access paths
Use public endpoints for supported data or assess the separate premium API for additional coverage.
Workflows with DefiLlama Prediction Markets
Compare venues
Select a metric and period in the sector table, then open each protocol profile to check coverage and definitions before drawing conclusions.
Explain a chart mismatch
Check parent-protocol versus individual-product scope, then compare volume definitions, date ranges and methodology.
Prepare repeatable research
Record the definition and observation date with the chart. For recurring analysis, check whether the series has a documented public endpoint.
Pricing and total cost
Core dashboards and public API endpoints are free. The annual Pro offer is $490/year, equivalent to $40.83/month under annual billing; premium API access is separate.
Free
$0
- Core protocol and sector dashboards
- Supported public API endpoints
Pro
$490/year; $40.83/month annual-billing equivalent
- Research and AI features, custom dashboards and Sheets
- CSV downloads
- Premium API is not included
API / Enterprise
Contact the provider for pricing
- Premium endpoints and higher allowances
- Enterprise data and licensing options
Fees and usage costs
- The API plan advertises 1,000,000 calls/month, 1,000 requests/minute and $0.60 per 1,000 additional calls.
Trial: The pricing page offers a 7-day Pro trial.
Access: The displayed monthly Pro equivalent is not a verified monthly-billing quote.
Getting started
Before you start: Missing metrics do not prove absence of activity, and protocol coverage differs.
- Open the prediction-market category.
- Choose a metric and a consistent comparison period.
- Open a protocol profile and read its methodology before exporting or quoting a value.
Account and subscription requirements depend on the selected feature.
Useful links
What to check
- Missing metrics do not prove absence of activity, and protocol coverage differs.
- TVL, open interest, fees and trading volume measure different things.
- Combined protocol and individual-product pages can have different scopes.
- Pro research features and premium API access have separate requirements.
A closer look
Ratings & reviews
User reviews 0
The main score switches to user ratings after 5 published reviews.
A specific example helps the next person choose the right tool.
Related tools
Browse category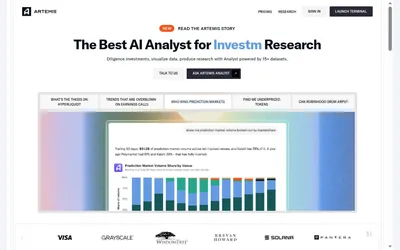

Prediction-market sector research within a broader financial platform, with question-driven analysis and exportable charts and tables.
- Access Web
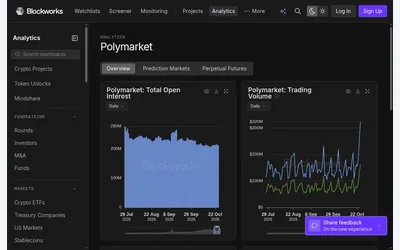

Volume, open interest and participation charts with market, category and lifetime-volume wallet segments.
- Access Web
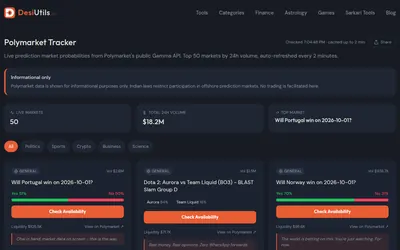

A free, account-free dashboard of 50 high-volume Polymarket questions and their outcome probabilities.
- Access Web
Frequently asked questions about DefiLlama Prediction Markets
Is the prediction-market dashboard free?
Core dashboards are in the free tier. Custom dashboards, CSV downloads and enhanced research have separate paid-plan requirements.
Is $40.83 a monthly subscription billed each month?
The retrieved offer pairs $40.83/month with $490/year as an annual-billing equivalent. Inspect the billing selector for a monthly-billing offer.
Does Pro include the premium API?
No. Pro research and premium API access are separate. Free public endpoints remain another access route.
Why can Polymarket charts disagree?
A combined protocol page may include several products. Time windows and definitions of volume, open interest or TVL can also differ.
Can these figures evaluate a trader?
They describe protocols and the sector, not an individual wallet’s returns or suitability for copying.