 PredictionToolkit

What is Wethr?
Station charts cover temperature and wind, and multi-station dashboards allow comparison in one workspace. Model tables and a viewer expose forecast paths; accuracy and bias tools help assess a model for the selected station. NWS evolution tracks official-forecast changes, Similar Days supplies historical analogues, and rain and tornado dashboards extend the event coverage.
Free observations add a three-minute delay to the source’s own release timing. Basic removes that additional delay, Professional adds model analysis, notifications and API access, and Developer expands capacity and station push coverage. Confirmed highs, probable extremes, nearby observations and final official climate reports are different inputs and may have different timestamps.
Who it is for
- For temperature-market researchers matching station observations to the contract’s rules.
- For users comparing model bias and developers consuming observations, forecasts, precipitation and notifications.
Features and coverage
- Station histories and dashboards
Review temperature and wind history, compare multiple stations and use temperature or high/low notifications on the eligible tier.
- Model paths, accuracy and analogues
Compare model tables and forecasts, assess station-specific accuracy and bias, track NWS revisions and inspect Similar Days for historical context.
- Additional climate views and APIs
Use rain and tornado dashboards and eligible REST or station-push access for observations, forecasts and precipitation. Developer also lists Model Accuracy and Nearby Stations APIs.
Workflows with Wethr
Match the station and window
Identify the exact settlement station and time window, then compare observations, neighboring stations and model paths without substituting a nearby station for the named one.
Assess model weighting
Use station accuracy and bias views before assigning weight to a model forecast in a probability estimate.
Size a weather monitor
Choose API or push according to request volume, station count and required delay, then configure station-specific delivery.
Pricing and total cost
Annual billing advertises two months free. Plans differ in additional observation delay, analysis tools, API capacity and push-station coverage.
Free
$0
- Current and historical charts, wind, extra 3-minute delay and ads
Basic
$14.99/month
- No Free-tier extra delay or ads; multi-station and widget dashboards; release schedule
Professional
$24.99/month
- Model and accuracy tools, notifications, 60 API requests/minute and 5,000/day
- Push for 5 stations
Developer
$99/month
- Professional features, 300 requests/minute and 100,000/day
- Push for all stations; Model Accuracy and Nearby Stations APIs
Enterprise
Custom
- Higher limits and integrations
Getting started
Before you start: A neighboring station can aid analysis but cannot replace the settlement station. Observation timestamps can differ from the final official climate report.
- Find the station specified by the contract and open its temperature or precipitation view.
- Read the legend and timestamps and compare model forecasts with observations.
- Select the delay and analysis tier you need, then configure station-specific alerts or API access.
Confirmed highs and probable extremes serve different purposes; read the chart legend before applying either to a contract.
Useful links
What to check
- A neighboring station can aid analysis but cannot replace the settlement station. Observation timestamps can differ from the final official climate report.
- Free’s extra three minutes sit on top of the source’s release timing; Basic removes that extra delay rather than changing when the source publishes.
A closer look
Ratings & reviews
User reviews 0
The main score switches to user ratings after 5 published reviews.
A specific example helps the next person choose the right tool.
Related tools
Browse category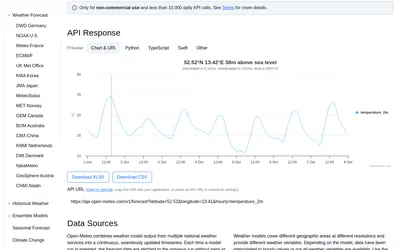

An external weather API for comparing models and reconstructing forecasts available at a historical decision.
- Access API
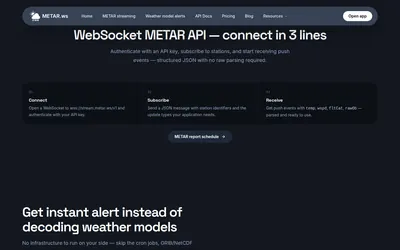
Stream airport reports and station-level model signals for weather research without building a GRIB parsing pipeline.
- Access API
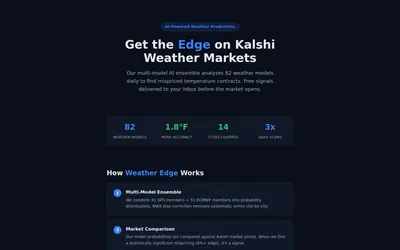
Weather-model research and free daily temperature-market signals for Kalshi.
- Access Web · Email
Frequently asked questions about Wethr
Which tier removes Free’s extra delay?
Basic and above remove the additional three-minute delay.
What API capacity does Professional include?
60 requests/minute, 5,000/day and push for five stations. Developer raises capacity and includes Model Accuracy and Nearby Stations APIs.