 PredictionToolkit
What is Polymarket Lens?
The historical proxy subtracts oneMonthPriceChange from the final outcome price. That trailing change can include resolution, so its name does not establish a forecast made exactly one month earlier. Markets below $5,000 in volume and records without meaningful price change are excluded, changing the study sample.
Read each bin’s observed YES frequency against its probability and the diagonal reference, then check the number of supporting markets. Brier score, directional accuracy and average outcome surprise summarize the selected sample. The surprise table opens individual resolved questions, while the active table compares returned bid–ask gaps; neither table executes trades.
Who it is for
- Readers learning how probability calibration is measured.
- Researchers examining surprising resolved questions.
- Developers studying a small public browser-analytics application.
Research coverage and methods
- Calibration plot
Compare each probability bin with its observed YES frequency and the diagonal reference line.
- Per-bin sample counts
Inspect how many markets support each point rather than treating all bins as equally supported.
- Summary evaluation metrics
Review Brier score, directional accuracy and average outcome surprise for the selected records.
- Resolved-market surprises
Find large gaps between reconstructed probability and the final outcome, then open the original question.
- Active spread comparisons
Compare the widest and tightest bid–ask gaps returned by current data.
- Methodology and open source
Read reconstruction, volume filters and exclusions on the page, or inspect and adapt the MIT-licensed source.
Research tasks
Interpret a calibration point
Select a bin, inspect its sample count and compare observed frequency with predicted level. Use the plotted values directly to determine the gap’s direction.
Investigate an unexpected resolution
Open a resolved-table entry and inspect the original question, timeframe and resolution.
Adapt the research method
An exact forecast horizon needs probabilities observed at known timestamps. Read the implementation before using its monthly-change proxy, and substitute timestamped historical observations when the study requires that timing.
Pricing and total cost
The public dashboard is free and its source is MIT licensed. Its client-side public-data requests require no account, API key or wallet connection.
Research inputs and access
- Open the dashboard, wait for public data and read Methodology before interpreting metrics.
- Inspect the calibration plot and bin counts, then open individual resolved markets from the surprise table.
- Use the repository to reproduce or change the calculation.
Useful links
What to check
- The monthly-change proxy may include resolution and has no established exact forecast horizon.
- Excluding markets below $5,000 volume and those without meaningful change alters the sample.
- Generated overconfidence/underconfidence labels can contradict the displayed gap direction; use actual bin values.
- A wide spread may reflect low liquidity and does not by itself demonstrate a profitable trade.
A closer look
Ratings & reviews
User reviews 0
The main score switches to user ratings after 5 published reviews.
A specific example helps the next person choose the right tool.
Related tools
Browse category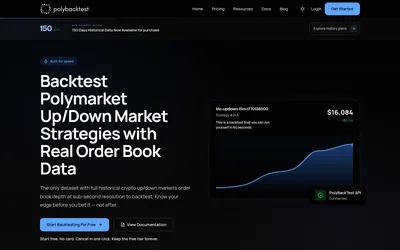
Replay short crypto rounds against recorded liquidity and keep Data API and AI-backtest entitlements separate.
- Access Web · API
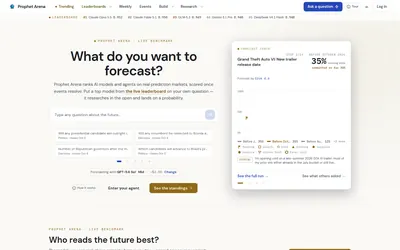

A live AI forecasting benchmark with resolved-event scores, comparable-event standings and inspectable research traces.
- Access Web
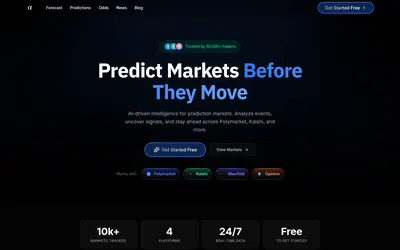

Request an AI forecast from a link, question or image, then compare market odds and news context.
- Access Web
Frequently asked questions about Polymarket Lens
Does Polymarket Lens need my wallet?
No. It requests public data in the browser without an account or API key.
How is the historical probability reconstructed?
It subtracts the market’s oneMonthPriceChange field from the final outcome price. This is a proxy, not a clean fixed-horizon observation.
Is the source available?
Yes. The linked GitHub repository uses the MIT license.
Does the spread table trade?
No. It displays returned bid–ask gaps for research.